Sometimes our users feel a bit puzzled on how to conduct their verifications in Validation Manager. The most common use case is comparison of quantitative results, but there’s quite a lot of variation on what that actually means. You verify your instruments when they have been installed in your laboratory, and later you do periodical checks to monitor the performance of parallel instruments, verify new reagent lots, etc. In different situations we have different needs, and this is reflected in the choices we make in Validation Manager.
So, let’s do a walk-through to see how to conduct a comparison in Validation Manager.
Make sure you have the instruments and tests that you need
Most verifications are done in situations where something is changing. They are conducted, for example, when you get new analyzers or reagent lots in your laboratory, or when there’s something else that makes it necessary to compare “before” and “after” results to make sure that everything works ok. Usually the “before” tests and analyzers already exist in your Validation Manager environment (since you’ve verified them earlier), but the “after” test and analyzers should be added. Once you have all the tests and instruments in place, you can use them in all your verifications, and your efforts in data management are minimized.
New analyzers
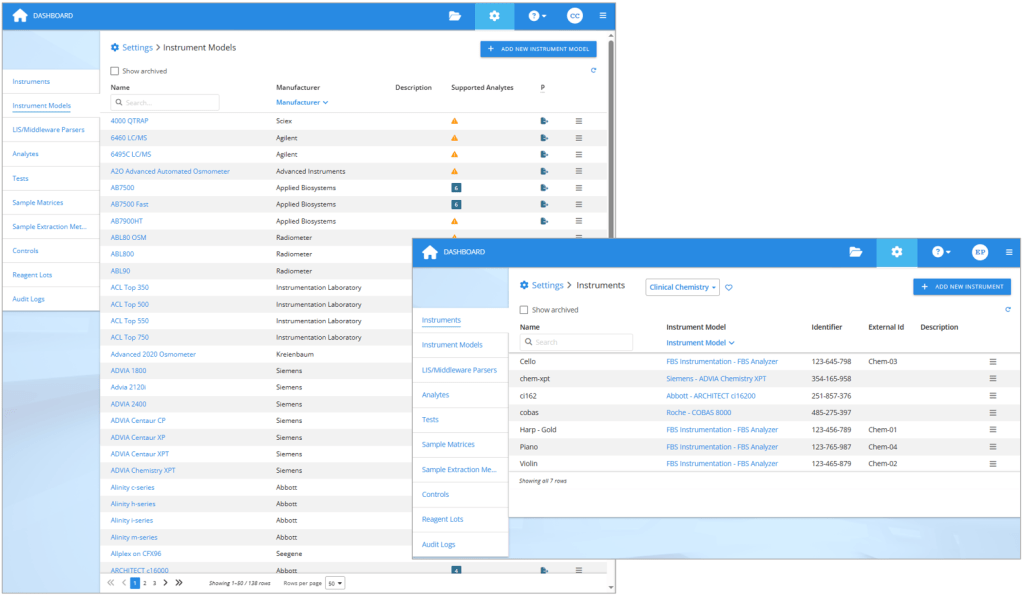
When you get new analyzers, add them as instruments in your Validation Manager settings. If you already have the same kind of instruments in your laboratory, simply add new instruments of the same type. But if you are starting to use new kind of analyzers, then you should first check if Validation Manager already supports the instrument model. You can see the up to date list any time in your Validation Manager settings and use search to find your model, but you’ll get a good idea of the options here on our web pages too.

On the left: The list of 138 instruments Validation Manager supports at the moment. On the right: Each analyzer used in verifications is defined as an instrument in Validation Manager settings.
If you cannot find the correct instrument model in Validation Manager, you can contact our support to send us an example export from the new analyzer. That way we can create the instrument model for you with the ability to import the export files it produces. Optionally, you can add the instrument model by yourself in Validation Manager settings. Once you have the instrument model in place, create the instruments using this new instrument model.
New assays or reagents
Similarly, when you get new assays, add them as tests into Validation Manager. For many manufacturers, we have templates that you can use to create the tests. When using templates, just remember to check that the created tests contain correct information. If no suitable template exists, you can just create a new test and give the related analyte information. Remember to attach your tests to the correct instrument model.
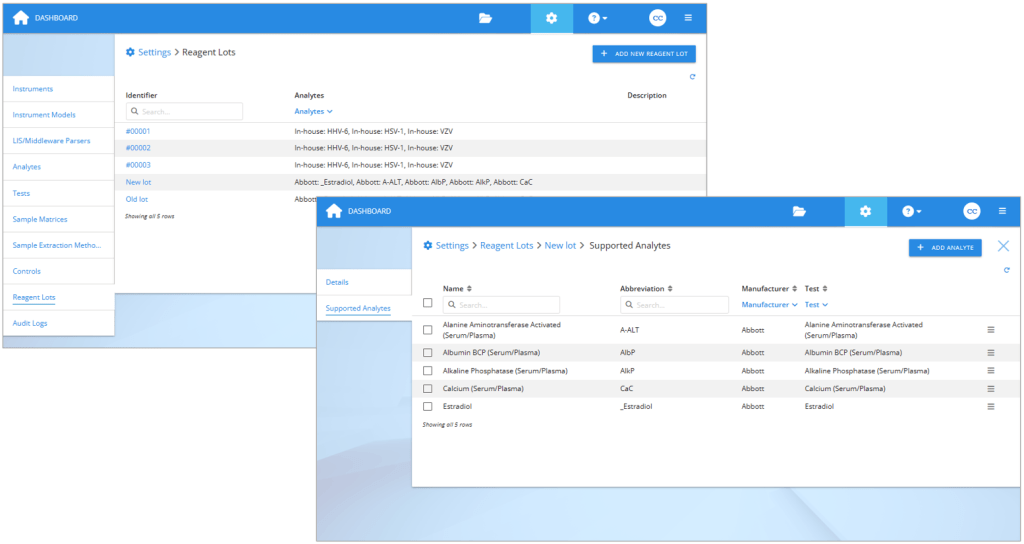
If you are planning to compare reagent lots, first create the reagent lots in Validation Manager settings. If you use the reagent lot identifier that will be present in the exported result files, in many cases Validation Manager will recognize it, and the results will be arranged automatically to your reports. It is optionally possible to use codes like “new lot” and “old lot”, and then later set this information to your imported results. After creating the lot, add the related analytes to it.

On the left: Reagent lots section in Validation Manager settings. On the right: Selecting analytes to a reagent lot.
Plan a Comparison study
We used to have different studies for different comparison needs, but now we have one study that’s meant for all comparisons of quantitative data. It’s called the Comparison study. It’s an improved version of the old studies for comparing quantitative data. The study contains the Plan, Work, and Report phases, just like all other studies in Validation Manager.
Build comparison pairs
When planning your study, you build comparison pairs of the things you are comparing. This is to document what you are doing in your verification, but it also enables automatic data management in Validation Manager, so that reports are created as soon as you’ve imported your results.
Planning analyzers to compare
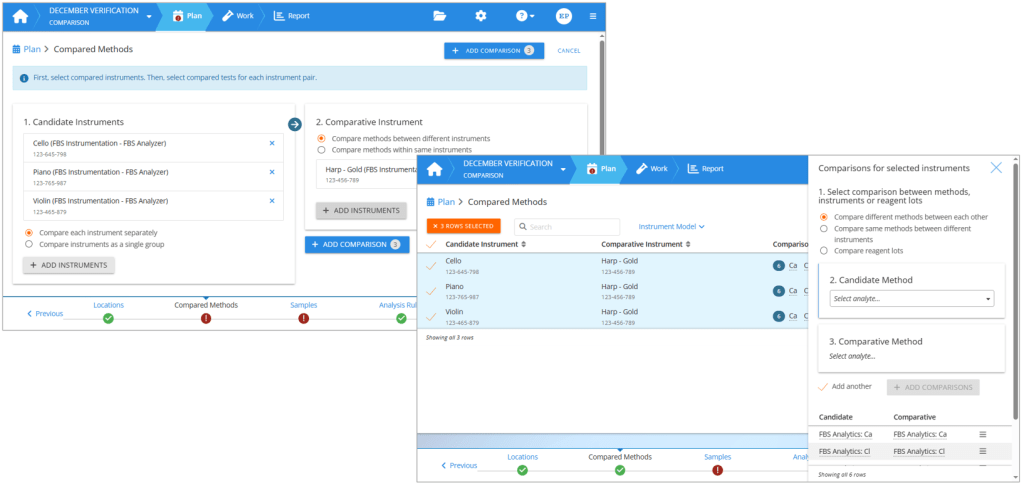
To build the comparison pairs, first select the analyzers you are verifying as candidate instruments. Then select your old analyzers or other reference devices as comparative instruments. If you are comparing reagent lots or tests within the same instrument, you can use your candidate instruments also as comparative instruments.
You can verify the analyzers individually, or all together as a group. When you compare instruments as a group, it basically means that you are not interested in individual analyzers but are running your samples for example on a line of analyzers, and the results can come from any of the selected instruments. The report will compare this line of analyzers with the results you are using as a reference. Or you can build your reference method using multiple analyzers and using their average result as the reference value to get a better estimation for the bias of the new method.
Planning analytes to compare
Once you have defined your instrument comparison pairs, you select the methods to be used in the comparison. If your analyzers are changing for example from one manufacturer to another, then you will select a candidate method and then the related comparative method. Repeat for all methods to be used within the same study. If you are verifying a new reagent lot, then you will similarly define comparison pairs between reagent lots. If you are comparing parallel instruments running the same tests, you can select to compare same methods between different instruments, and then simply select all the analytes to be verified.

On the left: Creating an instrument comparison pair. On the right: Setting method comparisons for selected instrument comparison pairs.
Define analysis rules
The next step that sometimes causes confusion is defining analysis rules. The most important rules to consider are how to handle test run replicates and how to compare methods, i.e., the first two settings on the left side of the screen.

Defining analysis rules in a Comparison study. The most important settings to check are listed first on the left side of the screen.
How to handle replicates
If you are running replicated measurements, i.e., each sample is measured multiple times on the same candidate/comparative instrument, then Validation Manager should do the calculations based on the average of replicates. This may reduce error related to bias estimation. Yet, using replicates is not required in comparison studies. If you do not use replicates, then it’s good to make Validation Manager do the calculations based on the first or latest available result. For example, some instruments automatically repeat a failing measurement and report both the failed and the repeated result in the export file. In these cases, if Validation Manager does calculations based on the latest available result, you don’t need to mind about these failing results in your data set, as they are automatically left out from calculations.
How to compare methods
The options for how to compare methods define how mean difference is calculated, and they are explained in more detail in an earlier blog post How to estimate average bias & use Bland-Altman comparison – tips & examples. Basically, when you use the study to evaluate the bias of the candidate method, and your comparative method is not a reference method, Bland-Altman difference is the way to go. If you are evaluating the difference between the candidate and comparative methods, or if your comparative method is so good that you can consider it to give true results, then you should compare methods directly.
Select study parameters and set goals
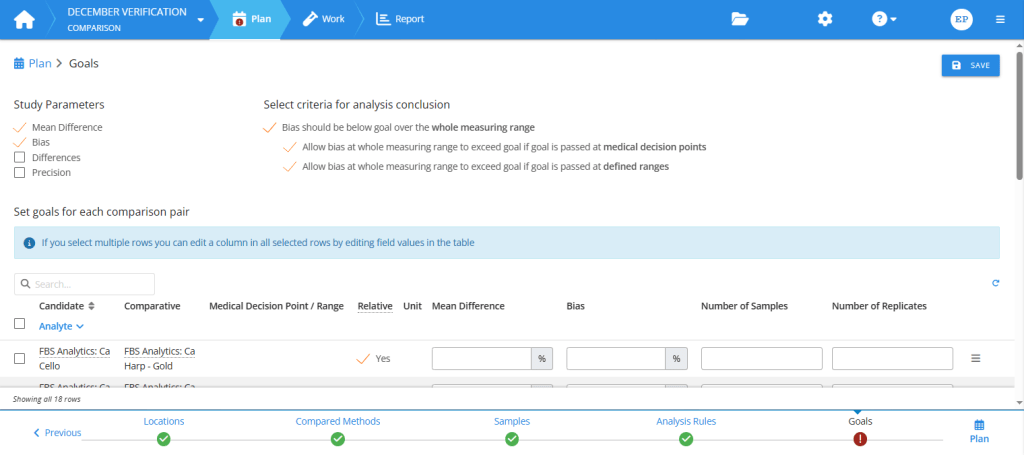
The first thing to do in the Goals step of your study plan is to select study parameters. The selected parameters are the main quantities to calculate for your report. You can then set numerical goals for the selected study parameters.
There are many benefits in setting goals. When you decide the limits of acceptable performance before seeing the report, the analysis conclusions will be objective, and Validation Manager will give you those conclusions automatically as soon as you’ve imported your results. Planned goals also make it easier for you to read your report and find the results that need your attention, as the colors and filters of the report page enable seeing all failing results with one glance.

Planning goals in the Comparison study. First, select study parameters. Then, set goals for these parameters and for sample collection.
To select the most relevant study parameters, and to be able to set goals, you need to understand what these parameters are. Three of them are basically related to estimating the difference between candidate and comparative measurement procedures. They are mean difference, bias, and sample-specific differences.
Mean difference
In situations where both your candidate and comparative measurement procedures use the same method for detecting the analyte, for example when comparing parallel instruments or reagent lots related to the same test, it is usually reasonable to assume that if the results given by the candidate measurement procedure differ from the results given by the comparative measurement procedure, the difference between them will not vary as a function of concentration. This means that we are looking for constant bias, and it can be calculated as mean difference. (For more information, please check our earlier blog post How to estimate average bias & use Bland-Altman comparison – tips & examples.)
Yet, it’s good to understand that mean difference simply states the average difference of the results. In many cases, mean difference doesn’t really tell much about the performance of the candidate measurement procedure. Sometimes bias is constant, but the data set is a bit skewed, and you should look at median difference instead. And if bias varies as a function of concentration, you should use regression analysis to estimate bias as a function of concentration. That’s why, when you use mean difference as your primary means of estimating bias, you should at least visually inspect the difference plots to check if it’s good enough for this purpose. Monitoring also bias as a function of concentration or sample-specific differences can help in assessing whether the assumption of constant bias is justified or not. If needed, you can measure more samples to get a better view of the situation.
Bias as a function of concentration
When the candidate method measures the analyte in a different way than the comparative method, often the difference between the results is not constant. In these cases, linear regression analysis is used to estimate bias. (For more information, please check our earlier blog post Why your laboratory should never use ordinary linear regression in method comparisons & what to do instead.) In Validation Manager, the term Bias refers to bias estimated using a linear regression model. If you need the best possible estimation for bias, this is the value you should be interested in.
But since linear regression is about fitting a line into the data set, it requires many data points spread throughout the measuring range. So as a rule of thumb, if you need detailed information of bias, you should measure a rather large set of samples. On the other hand, if you are doing a small comparison with only a few samples (e.g., 10 or less), then it’s probably not meaningful to select this parameter to your study.
In some cases, you can assess the performance of your candidate measurement procedure with a smaller set of samples, and only if there’s something suspicious in the results, you may want to add more samples and look at the results of the linear regression analysis too.
Differences
The third parameter for estimating bias is Differences. This is useful in studies where there are only a handful of samples, like small reagent lot comparisons or when ensuring a small set of EQA samples are all within bias goals, especially if the measurements are replicated. This parameter examines each sample separately, how big a difference is there between the results given by candidate and comparative measurement procedures. On the overview report, differences is expressed as the smallest and the largest sample-specific difference, and every sample is expected to give results within goals.
Precision in Comparison study
If you do replicated measurements, it’s also possible to check the variance of replicate results in this study. Standard deviation (or %CV) is calculated for each sample separately, and the smallest and largest results are reported on the overview report. Every sample is expected to give results within goals.
It’s good to understand that this estimation usually just describes the uncertainty related to your bias estimations, and to estimate the imprecision of your method you should do a Precision ANOVA study (for more information, see our earlier blog post about calculating precision).
Import you results and view your reports
Once you’ve filled out your study plan, you can import your results and start examining your reports. Validation Manager arranges all imported data automatically to your reports based on information of the used analyzer, sample ID, and analyte. So instead of spending your time arranging your results manually to spreadsheets, you can start viewing the related graphs and calculated results as soon as you have measured something.
For an introduction to our reporting features that help you in making your conclusions, please see the article Take your results analysis to the next level with Validation Manager’s new reporting features.
If needed, it is possible to go back to plan to make adjustments, like adding goals for medical decision points or for specific value ranges.
These are the main things to consider when doing comparisons of quantitative data. We hope this makes it easier for you to conduct your studies. If you have any questions or improvement ideas, remember that our customer support is always happy to gather ideas for product development and to help you with any issues regarding using Validation Manager!
Accomplish more with less effort
See how Finbiosoft software services can transform the way your laboratory works.


