

Lately we’ve been discussing about comparison studies for tests that produce quantitative results. But how about tests that give qualitative results?
Similarly as with quantitative tests, we can do comparisons between different measurement procedures to see how concordant results they give. It is also possible to measure the sensitivity and specificity of one method, if we know which ones of the samples truly are positive and which ones are negative. In this article we will look at these two approaches more closely. We will tell you how to efficiently do these comparisons and produce meaningful results to reduce risks and improve quality in your laboratory. We will help you tune your verification procedures so that they are easier to justify, and describe how Validation Manager helps you in your work with qualitative comparisons.
Option 1: Do you want to know how your results change if you change the measurement procedure?
When we compare measurement procedures, we can do comparisons between e.g. instruments running the same test or between different methods. The difference between comparing qualitative tests and comparing quantitative tests is that with qualitative results we cannot report bias, but try to find out the agreement between the compared measurement procedures instead. For example, how much we can expect the results to change when we switch from using one method to using another method. Will we be able to detect a specific condition of a patient as reliably as we did before?
The reported values are negative percent agreement (NPA) and positive percent agreement (PPA). NPA is the ratio of the number of samples measured negative with both methods to the number of samples measured negative using the comparative method. That means that it describes the ability of the candidate method to categorize as negative the samples that the comparative method categorizes as negative (or in other words, the ability to agree about samples that the comparative method finds negative). Similarly PPA is the number of samples measured positive with both methods, per number of samples measured positive using the comparative method, i.e. it describes the ability of the candidate method to categorize as positive those samples that the comparative method categorizes as positive. The equations are shown below.
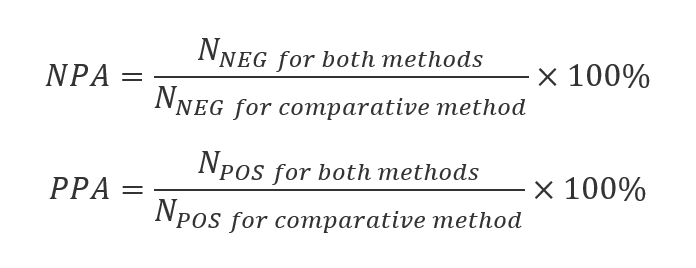
For example when comparing a new method to an old one, having 100% NPA and PPA means that changing the method does not affect the results our laboratory is producing. And if we are comparing two instruments running the same tests, having 100% negative and positive agreement means that we can trust the test to give the same results regardless of which instrument we are using.
Validation Manager calculates these values with their confidence intervals automatically for you, so you don’t really need to worry about the equations. It’s good to understand though what these values mean.
Below you can see what your report could look like. TP stands for true positive, meaning the number of samples with positive results from both of the methods. Similarly TN is true negative (number of samples with negative results from both of the methods), FP is false positive (number of samples for whom candidate method gave positive and comparative method gave negative result) and FN is false negative (number of samples for whom candidate method gave negative and comparative method gave positive result).

The green and orange colors on the report table tell whether the study goals have been reached or not. Setting the goals is recommended because it makes it easier to read the report.
Option 2: Do you want to evaluate the performance of your test?
Sometimes we want to get results that represent the performance of our new method instead of just agreement with another method. This requires a little bit more from our study setup, as we need to have true results with which we compare our new method. The term commonly used is Diagnostic Accuracy Criteria. That means a setup that gives the best currently available information about the presence or absence of the thing that we are measuring. (For a more accurate definition, see CLSI EP12-A2 User Protocol for Evaluation of Qualitative Test Performance.)
When we use Diagnostic Accuracy Criteria as a reference, we can calculate sensitivity (i.e., the probability that the test will give a positive result to a patient who has the condition) and specificity (the probability that the test will give a negative result for a patient who does not have the condition) of our candidate method. Moreover, we can calculate the positive predictive value (PPV, the probability that a person with a positive test really has the condition) and the negative predictive value (NPV, the probability that a person with a negative test really does not have the condition). The equations are shown below.

These equations for PPV and NPV require that the ratio of positive samples to the total number of samples used in our study matches the probability of finding the condition in our local population. For example, in the case of a very rare disease, this can be difficult to achieve because the number of negative samples required would be so huge. If 10% of the samples within our study are positive, while only 1% of the population has the condition under examination, the PPV equation above overestimates the probability that a positive result is a true positive. In that case, it is possible to correct the PPV and NPV equations by giving the prevalence of the condition in our population. You can find these equations with prevalence corrections, e.g., in Wikipedia.
Again, when using Validation Manager, you get these results to your report automatically. Specificity and sensitivity are given with their confidence intervals.
For PPV and NPV, we don’t calculate confidence intervals, but that does not mean that those values would be accurate. As there’s rarely exact information about the prevalence, and we don’t know the confidence interval related to the estimation that we are using as the prevalence, we cannot say anything sure about the reliability of the calculated PPV and NPV.

What if you compare the new method to your old one but still want to calculate sensitivity and specificity?
Sometimes laboratories want to report sensitivity and specificity even though they are only comparing their new method to the old one. This is not recommended. The main problems are:
-
You cannot know which ones of the discrepant results are caused by false results of the candidate method and which ones by false results of the comparative method.
-
You cannot know how many of the true positive and true negative results are related to samples that actually gave a false result with both methods.
Because of these reasons, the results of a method comparison do not represent the performance of the candicate method but only the agreement to the comparative method.
Some laboratories have developed procedures of additional checks to tackle these problems. If you choose this approach, you need to thoroughly know what you are doing and why you are choosing to do so. Otherwise, you won’t be able to understand what your results mean. A safe choice is to report the results of the comparison between methods as agreement instead of as sensitivity and specificity. You can use the results of the additional checks as explanatory information for the results instead of editing the calculated results based on them. We will get back to this in more detail in another blog post.
We recommend doing your verifications scrupulously and not trying to find any shortcuts. If you want to measure sensitivity, specificity, and predictive values, it is not enough to compare the new method to an existing one unless it’s a reference method. Instead, each and every sample needs to be compared with the Diagnostic Accuracy Criteria. Also, if you use replicate measurements or decide to rerun something to change result interpretations, you need to do this for all the samples. It’s the only way to make sure that your results will represent the performance of your candidate method.
Could it be that your reason for mixing up method comparison and diagnostic accuracy is that you actually need to have them both? You need to know how your results change when you change the method you are using, and you need to know how good your new method actually is. As Validation Manager makes it easy to create your reports and use the same data on multiple studies if needed, it’s best to do these as two separate studies. That way, you will have easily interpretable answers to both questions.
Creating a Diagnostic Accuracy Criteria
How the Diagnostic Accuracy Criteria should be built depends on what you are doing and what kind of methods you are able to use as a reference. If you have access to a real reference method, that would be the perfect method to use as the Diagnostic Accuracy Criteria. In some cases, Diagnostic Accuracy Criteria can be created by using multiple methods together as a reference and then deducing the true result from the combination of them all.
Validation Manager enables automatic interpretation of the results in a Diagnostic Accuracy study even when it’s based on multiple tests. When using Validation Manager, it’s also easy to find samples with discrepant results for a more thorough examination. If your test results are based on some quantitative values (e.g., PCR raw data), you can easily view them when examining your sample results.

What’s important is that you need to have reasoning for how the automatic interpretation is made (i.e., whether it’s a true negative or true positive interpretation that requires all the methods to give results that are concordant with each other). If you change any automatic result interpretations manually, you also need a solid argument for your choice. And these decisions cannot be based on the results given by the candidate test. That means, for example, that:
-
The results of your candidate method cannot affect how you interpret the reference results that form your Diagnostic Accuracy Criteria.
-
The results of your candidate method cannot affect what kind of a set of tests is used as Diagnostic Accuracy Criteria.
If you use information from the results of your candidate method in any way to form your conclusions on whether the samples really are negative or positive, then your candidate method is part of your Diagnostic Accuracy Criteria. That kind of wrecks the idea of the Diagnostic Accuracy Criteria. When you are evaluating the reliability of a method, it’s not a good idea to compare it to itself.
A practical tip for doing the measurements is that you should not start your data gathering with the candidate method. If your analyte decomposes fast, it may be necessary to measure each sample simultaneously with all of the methods. If this is not necessary, then it may be a good idea to start by gathering data to form the Diagnostic Accuracy Criteria. After achieving certainty of whether a sample is negative or positive, you can test it with the candidate method, ensuring that the person who conducts the analysis does not know This way, you can make sure that your Diagnostic Accuracy Criteria will be independent of your candidate method.
Other things to consider to ensure the reliability of your results
There are many things that you may need to consider when planning your study. Two things that concern all verifications are sample materials and the number of samples used in the verification. Especially for verifying tests related to rare diseases, it may be difficult to get enough positive samples. As a result, laboratories may do their verifications with only a small number of samples. They may also need to use samples that are not from their local population or are artificially created.
Sample materials can have a remarkable effect on the sensitivity and specificity of the test. There have been cases where clinically validated tests with, e.g., 99% sensitivity yield less than 60% sensitivity in a real laboratory environment. To help you notice problems related to sample materials, Validation Manager enables filtering the report by sample type. If there’s a significant difference between the results given by real patient samples from your local population and, e.g., your artificially created samples, you may consider removing these artificial samples from your study. To do that, you don’t need to go through these samples one by one. You can simply remove that sample type from your study plan, and your report is immediately updated.
The effect of the number of samples is purely about statistics. The more samples we measure, the more accurate the results will be. With small sample amounts, the effect of a single sample can be huge. For example, if we only measure 5 positive samples, one false negative result will drop our sensitivity (or PPA, depending on our study type) by 20%. And even if we don’t get any false-negative results, the confidence interval will be huge, stating that sensitivity (or PPA) can be anything from 56.6% to 100%.
When using Validation Manager, you can minimize the number of samples safely by importing your results to Validation Manager as soon as you get results for any samples. Follow the confidence intervals on your report to decide when you have gathered enough data. If the upper limit of the confidence interval is lower than acceptable, you have a reason to suspect that there’s a problem in your test, which you should find and fix before there’s any point in verifying the test. And when the lower limit of the confidence interval reaches an acceptable level, you can safely say that you have reached the goals you have set for your study.

The advantage of Validation Manager is that it makes your verification result analysis easy. It’s easy to find samples with discrepant results, it’s easy to review all results related to a sample, it’s easy to comment on the results, and it’s easy to remove sample categories from your report if needed. When you import your data directly from instruments, middleware, or LIS, you don’t need to worry about messing up your data as when working with Excel. You will have traceability of your results, and as you let Validation Manager take care of the analysis, you don’t need to worry about mistakes related to data handling. You can concentrate on things that cannot be automated, like clinical evaluation of your verification results or making your testing process shine.
If you wonder what to do with your discrepant results, and whether to rerun your tests, you might enjoy the next article that covers reruns and discrepancy analysis in qualitative comparisons. You might also want to check out some more authoritative views on the subject, like CLSI EP12-A2 User Protocol for Evaluation of Qualitative Test Performance or FDA article Statistical Guidance on Reporting Results from Studies Evaluating Diagnostic Tests.
Accomplish more with less effort
See how Finbiosoft software services can transform the way your laboratory works.


