

Due to the current coronavirus situation, there has been a lot of talk about COVID-19 tests. The general public is mostly concerned about the amount of testing, but there has also been a growing discussion around their reliability.
As quality of clinical tests is in the heart of our work, we wanted to share a few thoughts on the subject.
Here’s how you can use our Validation Manager to select diagnostics that actually works.
What’s it all about?
Before a new test can be taken to use, its performance must be evaluated. This is normally done by analyzing patient and control samples with known true values, and by statistically examining the quality of the results the test gives for these samples.
There are different ways to do that. A good starting point are the CLSI guidelines.
In Validation Manager, there are multiple studies that enable laboratories and test manufacturers to easily conduct their validations and verifications according to standards and guidelines.
Laboratories who do not yet use Validation Manager usually have a bunch of excel sheets for doing these calculations. While excel gives you quite much flexibility, it doesn’t really help you in your validations. You have to make sure by yourself, that all your data is really included in calculations. You cannot protect your data from mistakenly done manual edits. And later on it can be impossible to track, why your results are what they are. And after everything is done, you still have to go through all your data to manually construct your report. That’s a key reason why validations and verifications are often seen as tedious and wearisome.
With Validation Manager on the other hand, you have all your validations and verifications neatly in one place. Once you have planned what to do in your studies, all you need to do is import your data. And the best way to do that is day by day, always adding the most recent data on top of all your previous data. That way you won’t forget to include any results, and you can examine the report and make conclusions out of it as you go. What is convenient, is that you can import the results directly from instruments or laboratory information management systems. And once the results are imported, you even get your Word report with all the graphs and tables generated automatically.
With COVID-19, we are interested in whether the sample contains the virus or not. Therefore we are talking about qualitative tests, giving positive and negative results. (In Validation Manager we also have tools for verifying your quantitative tests, but this time we are skipping those.)
Comparing the test results to true values
An essential tool for validating a qualitative test is to compare the results it gives to the results of a diagnostic accuracy criteria, i.e. the true values of the samples. In Validation Manager, this is done in Diagnostic Accuracy study. The key parameters that we are interested in are:
- Sensitivity = the ability to detect the condition when it is present. It is the probability of a test to correctly give positive results when the sample contains the thing we are looking for. Sensitivity is measured by testing a rather large amount of samples that are known to be positive, and calculating the ratio of true positive results to the total amount of positive samples.
- Specificity = the ability to detect the absence of the condition when it is not present. It is the probability of a test to correctly give negative results when the sample does not contain the thing we are looking for. Specificity is measured by testing a rather large amount of samples that are known to be negative, and calculating the ratio of true negative results to the total amount of negative samples.
- Predictive values PPV and NPV describe the probability that the test result of a particular person is correct (PPV = patient with positive result really has the virus, NPV = patient with negative result really does not have the virus). To calculate these values you would need to know the prevalence of the disease. If you don’t know it but you would like to try out some values, you can simply change that value in your study plan in Validation Manager. It is also possible to copy your study and all the data in it, so that you can easily have reports of the same data with different prevalences within the same Word report.
The beauty in using Validation Manager is that once you’ve planned your verification, all you need to do is upload your data and see how your report looks like. And you can add more data in your own pace.

LoB and LoD (analytical sensitivity)
One thing we need to know about a test is how small amounts of the analyte it can reliably detect. In early stages of an illness, the amounts of viruses and especially their antigens are really small, so it is important to have an idea, how early a test is able to detect the condition.
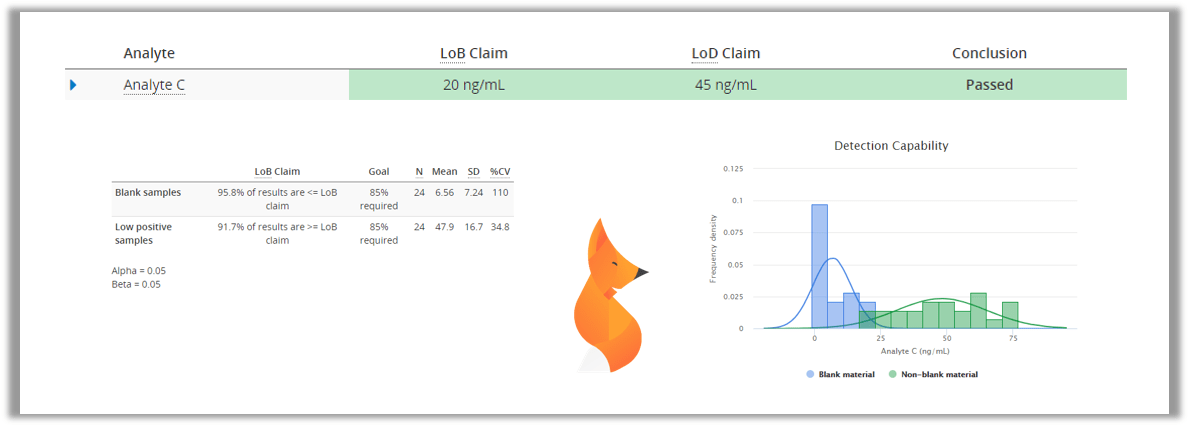
With most laboratory tests, even negative samples have a high probability of giving low results that would indicate the presence of e.g. COVID-19 antigen. Therefore we need to measure a set of negative samples to establish limit of blank (LoB), a value under which the results should be interpreted as negative. After that we would measure a set of low positive samples to establish limit of detection (LoD), the lowest amount of antigen that can be reliably detected. In Validation Manager, these values can be easily calculated by importing your data to Classical Analytical Sensitivity study.
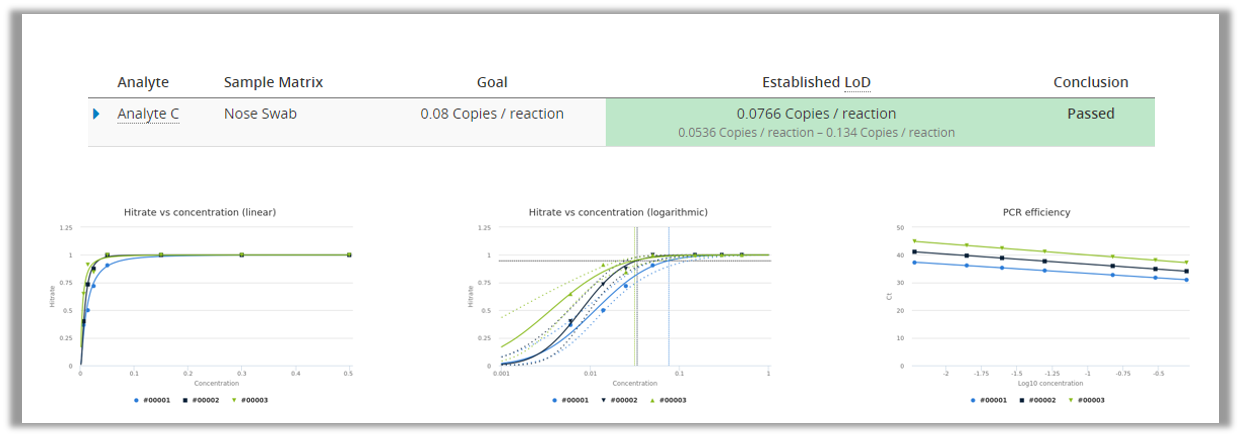
PCR technology is used for detecting the RNA of the COVID-19 virus from a sample. PCR is very good at detecting really small amounts of germs, and the technique of multiplying RNA/DNA makes sure that negative samples should not be mixed with low positive samples. Therefore we can assume that LoB=0 and only measure a dilution series of low positive samples to establish LoD using probit approach. This can be done easily by using Analytical Sensitivity study in Validation Manager.
Cross-reactions (analytical specificity)
To make things more complicated, we should also consider whether some other condition could cause the test to give positive results. (E.g. presence of another type of coronavirus. After all, before the current epidemic we already knew six species of human coronaviruses and a bunch that live in other animals.) To select the germs and medical conditions that could mistakenly be interpreted as COVID-19, you need knowledge of both the test and the conditions that could potentially be mixed with it. Then you need to collect samples with those conditions and test them with your new test. Analysing the results is not very difficult, as you only need to check that every sample gave a negative test result. But if you collect data through multiple days, managing the data and getting everything on one neat report might be a little painful. Uploading your data to Validation Manager as soon as you get it minimizes the time you would need to use organizing your data.
So whether you are developing or selecting COVID-19 diagnostics, Validation Manager can help you with effective validations and verifications. You will save time, and that may help you save lives.
Accomplish more with less effort
See how Finbiosoft software services can transform the way your laboratory works.