

We’ve recently published Quantitative Accuracy study. For the first time, we have enabled determining systematic error and random error in a single study and combining these values for estimating total error and measurement uncertainty. You can also use this study, for example, for tracking trends by importing your control results regularly into Validation Manager. On top of all this, we’ve made the smoothest workflow and the best looking report you’ve ever seen.
The measurement setup for Quantitative Accuracy
With Quantitative Accuracy study, one can estimate trueness, precision and accuracy of a method.
The samples used in the study should represent multiple sample levels, and these concentrations should be known.
To complete the study, CLSI EP10 protocol is recommended.
It is recommended to use both controls and patient samples. Controls are needed because their exact concentrations are known, unlike when comparing results from patient samples, where the reference results are affected by the uncertainty related to the reference method. On the other hand, control samples do not have the variation of the patient samples of your local population, and therefore patient samples are needed to describe the real laboratory use of the method.
If you’re not doing a validation but tracking test performance in routine QC, it’s naturally enough to use your control results.
What does the study give to you?
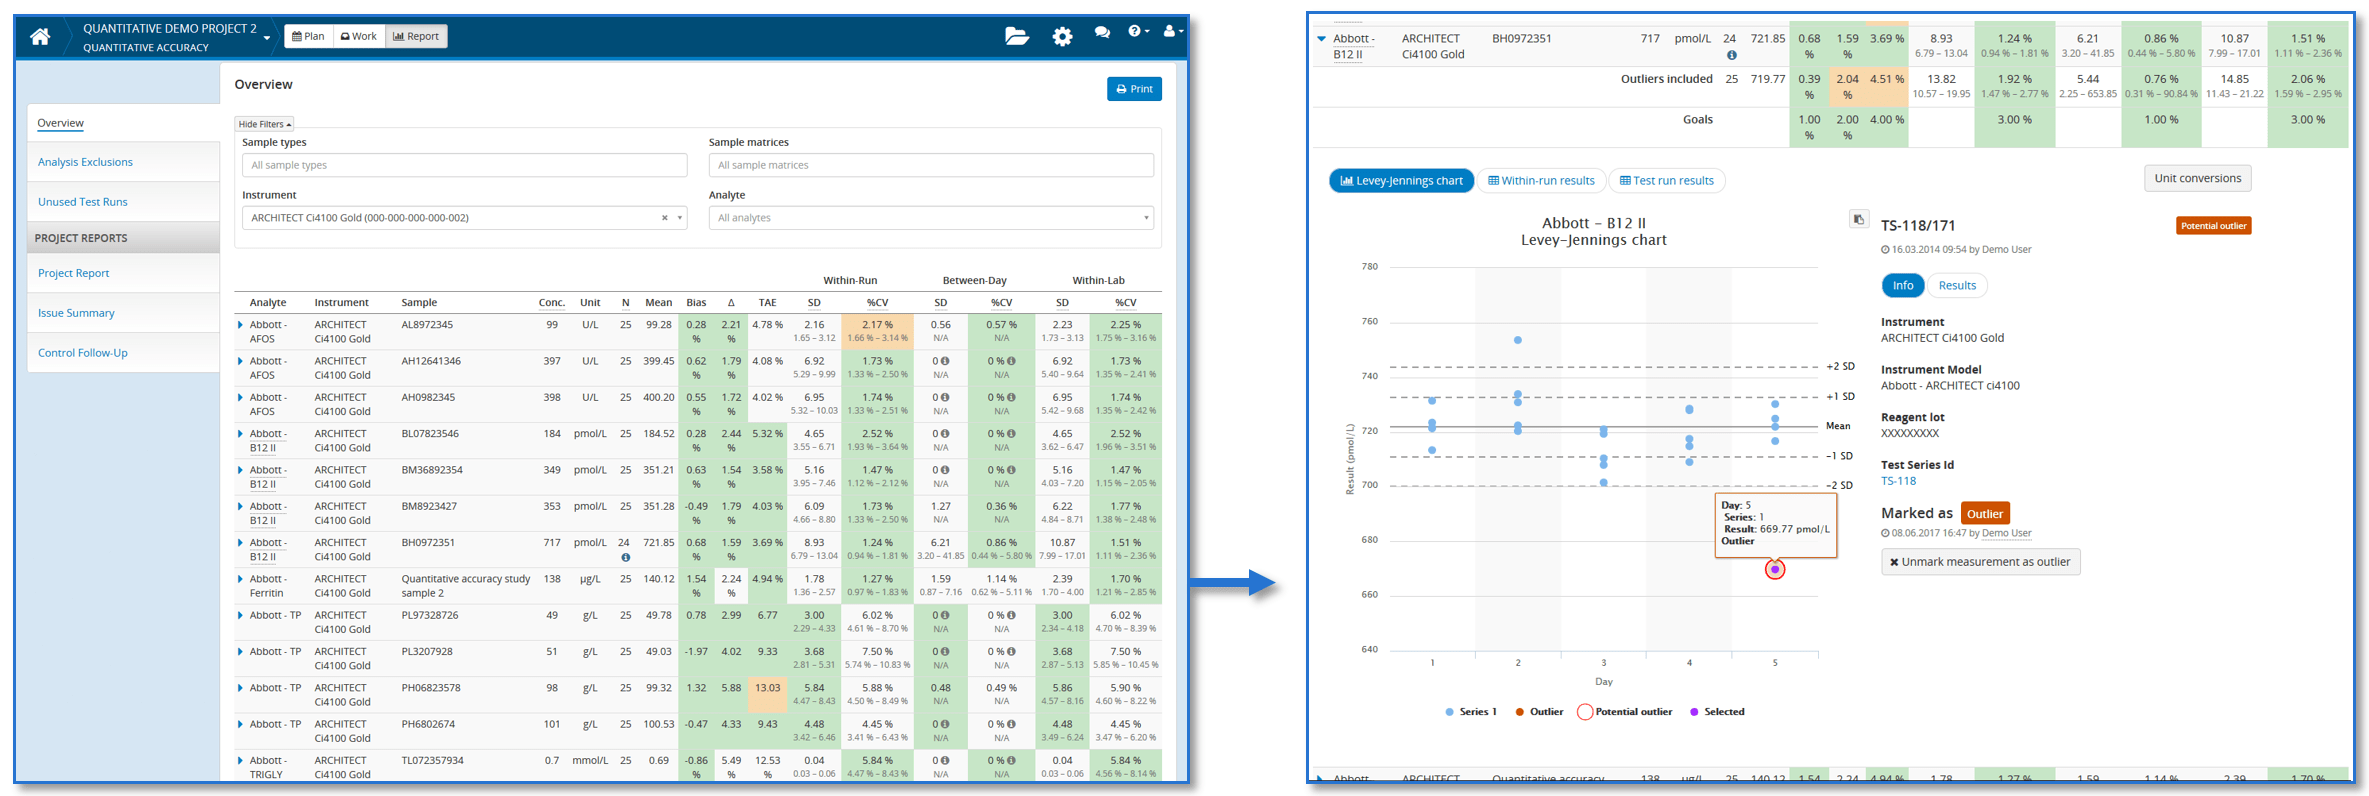
In Qualitative Accuracy study, Validation Manager calculates following values:
- Precision is calculated using ANOVA protocol which is introduced in our previous blog post.
- Trueness is calculated as bias between the nominal concentrations and measured values of the samples. By default it is given as relative bias, showing the amount of bias in respect to the nominal concentration.
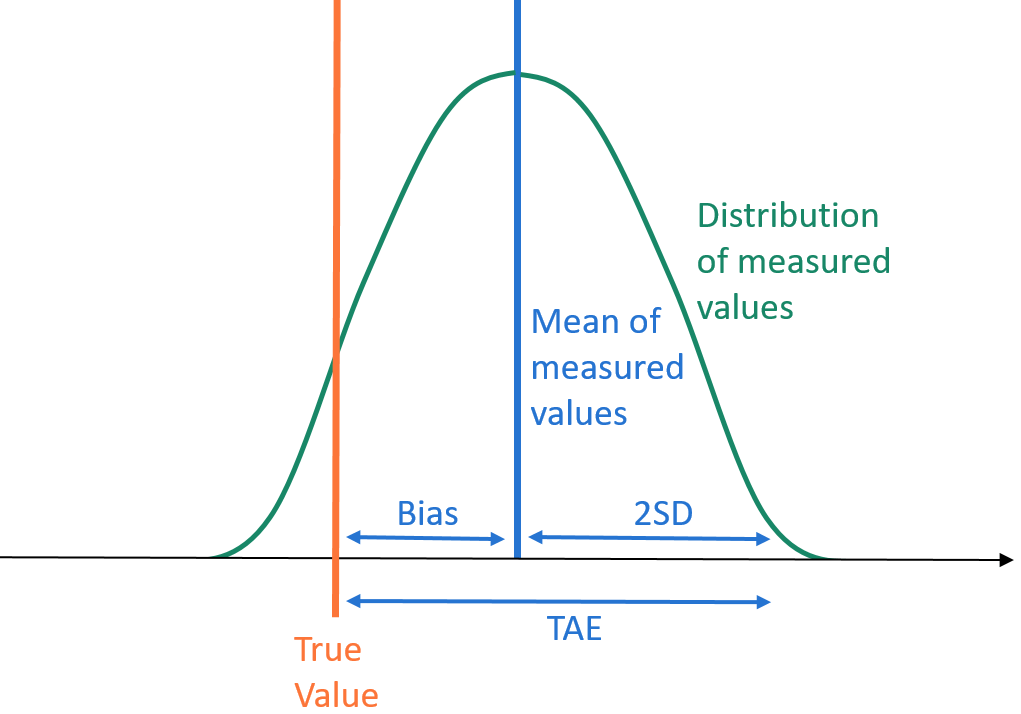
TAE is obtained by summing bias and two standard deviations
- Total analytical error (TAE) combines trueness and precision, summing bias (trueness) and standard deviation (within-laboratory precision) multiplied by σ, where σ=2 for 95% confidence level (based on Westgard, Carey, and Wold, 1974). TAE gives an upper limit on the total error of a measurement with 95% level of confidence. It is explained in more detail in this AACC article. Also worth reading are CLSI EP29 and EP21.
- RiliBÄK delta (∆) combines trueness and precision as root mean square deviation, and it describes the scatter of analytical results around target values (based on Rainer Macdonald, 2006). Originally ∆ was introduced to create one performance characteristic to control in routine QC instead of controlling bias and precision separately. It simplifies this work and enables fast assessment and detecting critical deviations early. Moreover, with a large number of replicates, ∆ equals basic measurement uncertainty (σ=1 or 68% confidence).
- Extended measurement uncertainty (U) combines trueness and precision as square root of sum of squares of different sources of error (σ=2 or 95% confidence). Compared to TAE, U has the advantage of treating bias equally as imprecision, making it a more sensitive indicator for problems in bias. More details can be found here.
Setting goals makes your report easier to interpret
To give you a possibility to easily evaluate the calculated results, we’ve added an option to set goals for all these performance figures. Validation Manager compares calculated values to goals visualizing whether goals are met or not on each analyte-sample pair. So when you go through your results, it’s enough to look closely those results that do not meet the goals. As goals are analyte specific and each analyte is measured using several samples, this saves your time.
The revolution in Validation Manager
With Quantitative Accuracy study we don’t just give you a new tool for validations. We expand your possibilities as a user to get assistance from Validation Manager in periodic QC as well. We’ve also upgraded your user experience in quantitative studies. And with these new software design decisions, we have clear goals for further improvements that will be introduced in near future. So Quantitative Accuracy has brought us good new winds to head for an even smoother future of validations and verifications.
Accomplish more with less effort
See how Finbiosoft software services can transform the way your laboratory works.


